(from "Research on Whales", ICR, 1995)
Dr. Fujio Kasamatsu
In contrast with such resources as fossil fuels, which cannot be replenished, living resources (including whale stocks) can be utilized forever by man, provided they are managed in a proper manner that takes into account their unique characteristics. With the explosion of the human population, the demand for living resources is bound to increase still further. For living resources to be utilized sustainably, information is needed on their population characteristics and dynamics, as well as population size. In other words, it is essential to monitor the current population size of each resource, and how it changes over time. Estimating the abundance of terrestrial fauna and flora is relatively easy compared with marine animals, which are ordinarily hidden from view, and in particular when surveys of marine animals must be conducted in harsh environments such as the Antarctic Ocean.
At the 40th annual meeting of the International Whaling Commission (IWC) held in 1990, the IWC's Scientific Committee completed a comprehensive assessment of the Southern Hemisphere minke whale, and unanimously agreed on an estimate for the current population size of 760,000 animals, mainly in waters of south of 60 degrees S. Providing the basis for this estimate were the results of the systematic sighting cruises which had been taking place discretely and steadily in the Antarctic Ocean over a 12-year period. This report outlines these sighting surveys in the Antarctic Ocean, and summarizes the results.
Abundance Estimates of Whales
A variety of methods has been used to estimate the abundance of whales. A representative method is catch-per-unit-effort (CPUE) analysis, one of the methods for calculating population abundance which utilizes catch data of exploited species. This method, called the Leslie-DeLury method (Mackintosh, 1965: Seber 1982), expresses the relationship between CPUE and cumulative catch as a simple linear-regression equation. The intercept of the regression line on the cumulative-catch axis gives an approximate measure of the initial (i.e., preexploitation) population size.
The CPUE method was used on many occasions by the IWC's Scientific Committee in the 1960s and 1970s for estimating the abundance of humpback whales off the coast of Australia, sei whales in Area III of the Southern Ocean, and Bryde's whales in the North Pacific. The method was found to be problematic, however, with questions being raised about the reliability of unit effort (a key variable) and the instability of the relationship between the changes in population abundance and the CPUE. Accordingly, this method has been used little since the beginning of the 1980s.
In the 1970s, the Scientific Committee began analyzing and determining population abundance through studies of intrinsic population parameters, taking advantage of rapid advances in computer technology. The models available for analysis can be divided into two major groups: surplus production and analysis models. The latter group includes, for example, the BALEEN model (Report of the International Whaling Commission, RIWC 29, 1979). This method utilizes information on catch size and a variety of biological information, e.g., the age at recruitment, the pregnancy rate, and the natural mortality rate. It was applied in the estimation of populations of baleen whales such as Antarctic fin whales, sei whales, and minke whales. However, the method has a drawback: it relies heavily on having unbiased biological information but in reality the information used was often biased since it was derived from commercial operations.
The mark-recapture method, which has been used to study the ecology and abundance of land animals, has also been applied to whales. In this method, whales are marked and allowed to return to their stock, and the population size is then estimated from the number of marked whales which are subsequently recaptured, based on the assumption that the ratio of the number of recaptured marked whales to the total number of whales captured is equal to the ratio of the number of all marked individuals to the size of the population. In 1932, the Discovery Committee of the United Kingdom begun systematic marking surveys of large whale species in the Antarctic, providing information on the distribution, movements, growth, and ages of whales, as well as information on population size. The mark-recapture method was applied to a number of whale species and produced valuable biological information. As a means of calculating population abundance, however, the unreliability of the abundance estimate because of small number of marks that had been recovered became an issue, and it became impossible to reach agreement on estimates of population abundance by this method.
Visual Methods
Unlike the indirect methods discussed above, which rely on information on catch size, catch effort, and biological information, visual methods attempt to estimate population abundance by directly counting the number of whales. Visual methods have been used to estimate populations of wildlife since the 1930s but in the 1960s, great improvements began to be seen in the methods used to conduct surveys and estimate populations. Initially, visual methods were applied to only a few species of land animals, such as deer and rabbits, but in the 1960s they began to be applied to wild fowl such as quail, grouse, and ducks; ungulates; and reptiles such as lizards. Visual methods began to be seriously applied to whales in the 1970s, and by the end of the 1980s had become the primary tool for estimating whale populations.
Line-Transect Method
Counting all the individuals in the population of a life-form is the most direct and straightforward method of determining the size of the population. However, as populations are typically distributed over extensive areas, the time and cost factors involved in counting all the individual members of a population make this approach unrealistic, if not impossible. Moreover, this approach is impractical if the animals under study are highly mobile or their distribution density per unit area is low. The line-transect method was developed for the surveillance of animals which are mobile, are distributed over extensive areas, and have a low distribution density (Wildlife Monograph 72, 1980).
In the line-transect method, observers (whether on foot or aboard a ship, airplane, or automobile) move along a predetermined survey line at a given speed and gather information on the number of animals and related information - in particular, the distance between the observed animals and the survey track line - which are sighted along the survey track line.
For simplicity's sake, let us assume that all the individual animals within a distance (w) of the survey line are sighted. The effective survey area is equal to 2Lw, where L is the length of the survey line. If (n) animals are sighted within the area 2Lw, the density (D) of the animals within the effective search area is estimated to be:
D = n/2Lw
If we express the effective survey area by A, the total number of animals within the survey area (N) is given by the formula:
N = D x A = nA/2Lw
In practice, a number of factors must be considered, such as the ease of sighting the animals and the proportion of animals that might be overlooked.
Line-Transect Surveys in the Antarctic
The application of visual methods for estimating population abundance of whales and calculating population density indices was first reported by Mackintosh and Brown in 1956. During the 1933 - 1939 cruise of Discovery II in the Antarctic, Mackintosh and Brown used the sighting data to arrive at monthly estimates of the sizes of the fin whale and humpback whale populations. This was the first attempt to estimate population size using sighting data, although it involved rather crude elements in terms of the evaluation and quantification of search effort, the relationship between search effort and sighting, and the detection function and effective search width.
Subsequently, visual methods used to estimate population abundance or density were not regarded as independent methods, but were used merely to verify estimates obtained by the CPUE method or population dynamic models. However, in the late 1970s, questions arose as to the reliability of the data being used for CPUE analysis and dynamic models. Moreover, questions were also being raised about the mark-recapture method concerning the reliability of population estimates and the absence of information on how many marks were being shed. It therefore became an urgent task to produce more reliable estimates of population abundance.
At the 1978 meeting of the IWC's Scientific Committee, the importance was stressed of estimating the stocks of Southern Hemisphere minke whales, then the principal target of commercial whaling operations in the Antarctic. Dr. Peter B. Best of South Africa and Dr. S. Ohsumi and Mr. K. Yamamura of Japan - then the leading authorities on the assessment of Southern Hemisphere minke stocks - proposed the first systematic marking and sighting cruise. In December 1978, Dr. Best led the first IWC/IDCR Southern Hemisphere Minke Whale Assessment Cruise, conducted as part of the IWC's International Decade of Cetacean Research program (hereafter: IDCR cruises), from Fremantle, Australia, aboard two survey ships provided by Japan.
Survey Method
The Antarctic Ocean is so vast as to make it all but impossible to survey in one trip. The IWC therefore decided to survey one area each year from the six areas into which the Antarctic Ocean had been divided for the management of baleen whale stocks. Decisions regarding which area to survey and the basic contents of the survey are reached each year by the Scientific Committee. A detailed outline of the survey is subsequently developed by a committee of several experts commissioned by the Scientific Committee of the IWC, and the experts then consult with the members of the survey team immediately before the survey commences.
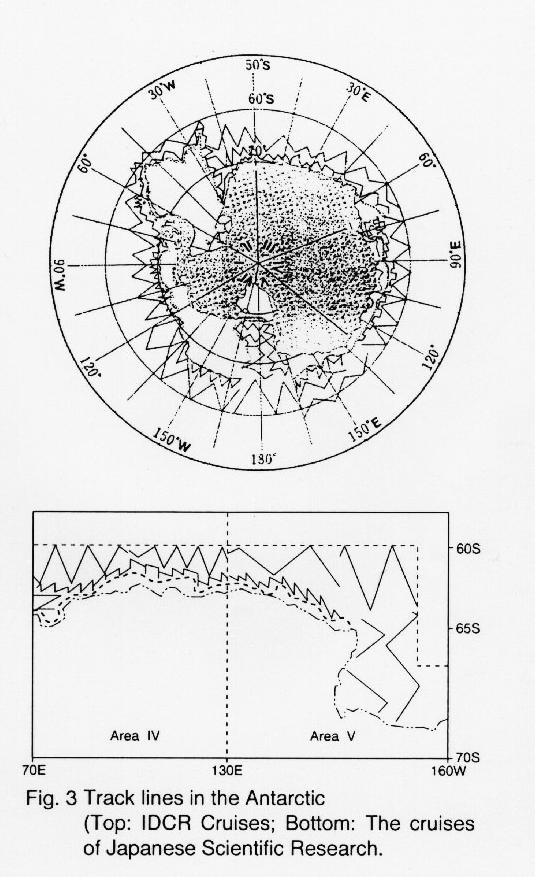
One of the most important considerations in planning a survey cruise is the design of the survey track line. Since southern minke whales are not randomly distributed in the Antarctic Ocean, it is necessary to establish the survey track line as randomly or systematically as possible. At the same time, in order to improve the accuracy of the population estimate which the survey yields, it is necessary to devote as much sighting effort as possible to those areas where large numbers of minke whales are distributed, i.e., close to Antarctica. Based on the consideration of these factors, the Scientific Committee's experts adopted the sawtooth wave pattern currently being used for survey routes. Fig. 3 shows the track chart of the IDCR cruises carried out in the Antarctic during the period 1983-1991.
Each survey ship, which carries three observers appointed by the IWC, conducts the survey by sailing on a predetermined course at a predetermined speed. If a whale school is sighted, the ship approaches the school and records the species of whale, the number of animals, the body lengths, the number of calves, and behavioral patterns. Having recorded this data, the ship returns immediately to the survey line. It should be noted that any other whale school spotted during the approach to, or observation of, the first school or during the return to the survey line is categorized a "secondary sighting", and is disregarded when estimating the population size. The determination of the species must be done by carefully identifying the distinguishing features of the body. If positive identification is impossible because of the distance of the school from the ship, the record shows the entry "like minke", for example, and the sighting is disregarded when estimating the population size. The observers constantly strive to ensure that sighted schools are not the same as previously recorded schools. If there is even a slight possibility of duplication, the most recent sighting is not included in the sighting record. Such duplication, however, is unlikely to occur anyway, as the survey ship is normally moving at 12 knots, considerably faster than the normal swimming speed of the minke whale of about 3 knots. The record of sighted schools, including solitary whales, contains as many as 50 categories, which are coded to facilitate input into the IWC's computer. In addition, records are made of environmental conditions, such as ice conditions, water temperature, and weather.
The report on each survey cruise is usually submitted by the cruise leader to the Scientific Committee, which then discusses it and uses the raw data for subsequent exercises aimed at estimating population abundance. Many other field experiments are conducted including those on the behavioral patterns of whales related to the estimation of population size, and on the estimation of probabilities that whales on the track line will be seen, an important factor in the estimation exercise. A summary of these experiments is given in Table 1. The cost of conducting these experiments so far has amounted to about US $ 2.1 million (surveys costs not included), more than 90 % of which has been covered by the Japanese government. The experiments have served not only to clarify the ecology of whales but also to significantly improve the accuracy of the population estimation method (RIWC: 41 and Distance Sampling, 1993).
Table 1. Summary of Experiments Conducted on IDCR Cruises
Whale Behavior
| Blow rate and duration experiment | Observation of the frequency and duration of surfacing and blowing |
| Diving time experiment | Observation of diving time |
| Density gradient experiment | Observation of density decrease with distance from pack ice |
| Radio tagging experiment | Observation using radio tagging |
| Reaction to ship experiment | Observation of whale reaction to survey ship |
| Swimming speed experiment | Observation of whale swimming speed |
Survey methods
| Distance calculation experiment | Comparison of distance estimated by observer and distance calculated from ship's speed and time |
| Angle and distance experiment | Accuracy check on angle and distance estimated by observer |
| Length estimate experiment | Estimation of body length using camera |
| Observer behavior experiment | Observation of distribution of search effort by angle from ship's bow |
| Graticule-binocular experiment | Test of use of binoculars with graticule |
| Secondary sighting experiment | Evaluation of effect of secondary sighting |
| Angle board experiment | Test of use of angle board used for estimating sighting angles |
| NNSS closure experiment | Estimation of distance using Satellite Navigation System |
Estimation of probability of a whale on the track line
| Valuable speed experiment | Observation of sighting rates at different speeds |
| Parallel ship experiment | Observation of sighting rates of two ships running in parallel |
| Independent observer experiment | Observation of sighting rates of two independent observers on same ship |
Mark-recapture method
| Mark-recovery experiment | Test of whether mark can be completely detected |
| Mark-verdict experiment | Accuracy test of marking verdict |
| Mark-verdict experiment | Observation of mark penetration into whale body |
| Streamer-mark experiment | Test of use of newly developed streamer marks |
A sighting survey provides information on the present size of a population, but it does not provide biological information or information on dynamics, such as in which direction the population is changing or any problems that might be emerging within the population. Since 1987, Japan has been conducting a research program in the Antarctic which employs a systematic random-sampling method totally unlike the criteria used to select whales by commercial whaling. The samples provide biological information that can be used to predict population dynamics, an important tool - when used in combination with information on population size - for the effective management of whale stocks. The quality of this information depends heavily on the manner in which whales are selected for sampling, and for this reason a sampling technique has been designed which ensures that each school, and each whale in each school, stands an equal chance of being selected. The Japanese research program also uses a method more rigorous than that used for IDCR cruises to ensure that the starting point of each cruise is selected at random.
In addition, since 1976, Japan has been monitoring stocks of large whales in the Southern Hemisphere thought to have been depleted by commercial operations. These surveys have covered all waters of the Southern Hemisphere except for the northern part of the South Atlantic. During the period from 1976 to 1987 (the period analyzed by this author), the total length of the survey lines reached some 1 million kilometers - about 25 times the circumference of the Earth.
Evaluation of Survey Results
The results of these sighting surveys are first analyzed by members of the IWC secretariat skilled in mathematical analysis. The results of their analyses and population estimates are then reported and discussed at the annual meeting of the Scientific Committee. The survey methods, the accuracy of the collected data, estimation methods, and the results of experiments are subjected to examination, with particular scrutiny being applied to identify possible biases in the data and the estimation methods.
In adopting the 1982 moratorium on commercial whaling, the IWC instructed the Scientific Committee to complete a comprehensive assessment of whale stocks by 1990 at the latest. Priority was given by the Scientific Committee to the Southern Hemisphere minke whale, which was then the principal target of commercial whaling and would remain so until 1987. It devoted its energies to estimating population abundance - a key component of the comprehensive assessment - and to enhancing the accuracy of the estimation. Dr. D.S. Butterworth of South Africa and Dr. S.T. Buckland of the United Kingdom led the Scientific Committee in rigorous debate and analysis of the data, toward making a comprehensive assessment of the whale stocks. In 1990, at the 40th annual meeting of the IWC held in the Netherlands, the Scientific Committee completed the comprehensive assessment of the Southern Hemisphere minke whale stocks, including a unanimously accepted estimate for the population size of 760,000 (RIWC: 41 p. 59, Table 1).
Reliability of Population Estimates
The error (here: coefficient of variation) in the Scientific Committee's best estimate of the abundance of the southern minke whale is 9 % (RIWC: 41; Nature, Vol. 357). The errors in similar population estimates based on visual methods used in areas other than the Antarctic are 15 % for minke whales in the Northeastern Atlantic, now being commercially harvested (RIWC: 43); 35 % for the West Greenland stock of fin whales where harvesting is permitted as aboriginal/subsistence whaling (RIWC 43); 24 % for the West Greenland stock of minke whales where harvesting is permitted for the same reason; and 15 % for common dolphins in the Northeastern Pacific, which are accidentally killed in the tuna fishery (RIWC: 44), and 31 % for walruses in polar seas (Marine Mammal Science 1989). Clearly, the estimate for the population abundance of southern minke whales is more reliable than any of these other estimates. Its error can be compared with the 5 % obtained for the estimate for gray whales in the Northeastern Pacific (RIWC: 43) and the 7 % for bowhead whales (RIWC: 43).
Meanwhile, estimates of the circumpolar populations of seal species, which occupy an ecological niche equally important in the Antarctic to that of whales, remain crude by comparison, and the accuracies of the estimates have not even been calculated (Antarctic Ecosystem, 1990). Considering this fact, and the fact that southern minke whales must be surveyed under harsh conditions in a remote part of the world, it is acknowledged that the degree of accuracy in the estimate of southern minke whales is extraordinarily high. It is also edifying to note that the error of density estimations of land-based birds by visual methods, which can be surveyed far more easily than can animal populations in the Antarctic Ocean, are at about 10 % or so (Distance Sampling, 1994).
Concluding Remarks
Since 1986, the human population of the world has grown at an annual rate of nearly 2 %, while the production of cereals has increased by about 1 % annually. Each year in China and Africa, a land area almost equal to that of Metropolitan Tokyo is transformed into desert. The huge underground aquifers of North America that have supplied irrigation water to the U.S. Midwest - an area which has played an important role in the expansion of cereal production since the 1970s - are slowly being depleted. We can no longer expect of forests to be turned into farmland. On the contrary, the relentless growth of populations in some developing countries in Africa has resulted in a shortage of firewood, a basic fuel, and the demand for wood for cooking now exceeds the reproductive capacity of these countries' forests. The natural limits on land that can be given over to cereal production (land erosion and desertification) are now becoming evident, as is the finiteness of fresh water. The prospects are poor for new technologies that will supplant the chemical fertilizers which have contributed so much to expanding our agricultural and livestock production.
Brown University in the U.S. has estimated that it would be possible to feed a population of some 6 billion, assuming that all foods are divided equally among all people, no cereals are used as animal foodstuff, and all humans become vegetarian (Environment in Peril, 1991). However, if everyone were to embrace the same diet as the typical North American, who derives some 35 % of his or her calorific intake from animal-derived foods, the number falls by more than half to no more than 2.5 billion.
The International Population Development Conference held in Cairo in 1994 failed to agree on a common policy that would check population growth, with the result that an explosion of the world's population now seems inevitable. Improving the living conditions of the world's population is no easy task when the per-capita quantity of land-based resources - in our forests and on our farms - continues to fall as the population rises. The demand for marine resources that can be utilized sustainably will therefore increase sharply in the years to come. However, the fact that 82 % of the estimated potential yield of marine resources of 120 million tons per year is already being utilized means that there is little room for further development. It is therefore essential to ensure that those resources which have already been developed are utilized as effectively as possible. Whale populations, in particular those in the Southern Hemisphere, feed on plankton and deep-sea squid which humans cannot utilize directly or on a large scale. Therefore, sustainable utilization of whales entails not only their direct utilization but also the effective utilization on a global scale of unutilized resources via whales. In spite of this scientifically rational position, however, an ideology is spreading like an epidemic in the Western world that totally rejects all consumptive utilization of whales, regarding them instead as sacred creatures.
In the latter half of the 20th century, our awareness of the relationship between nature and man has changed dramatically. In the United States in particular, people with Puritan beliefs, who once regarded nature as a frontier to be conquered, came to the realization, as environmental disruption became serious, that the environment in which they lived and the Earth itself were being put at risk. As they then began to question the sin of man's arrogance, their attitude toward the environment quickly changed to that of "harmony with nature and environmental friendliness". In this period of chaotic transformation, the utilization of whales as a resource became the first political issue to be raised as an example of environmental disruption and the sin of man's arrogance.
Initially, the crusade was based on the scientific and conservationist concern that whales might be headed for extinction. Subsequently, however, supporters of animal rights, with a grounding in the ethics of radical environmentalism, sought to impose on the world an ideology that treated whales as sacred, and demanded an end to all consumptive use of whale resources. This movement of a minority of extreme environmentalists who hold certain animals (which are not threatened by extinction) sacred has enjoyed a steady flow of both financial and political support. It has no relevance whatsoever, however, to the concept of sustainable utilization of resources, which is fundamental to man's efforts to improve living conditions, faced as we are with an impending population explosion. It is thus incumbent on every country to place the highest priority on developing a strategy for the conservation, study, and sustainable utilization of all living resources.
The solution, in the final analysis, may have to be political. Any political decision, however, will have to be buttressed by natural science, and particularly biological science. Otherwise, the result will be unbalanced development and poor utilization of resources. Ironically, cod stocks in the Northwest Atlantic, which are thought to have been depleted to about 10 % of their initial level, continued to be commercially harvested up to recent times, whereas the harvesting of Southern Hemisphere minke whales, now thought to be more numerous than ever before, is banned. Extreme environmentalism and animal rights ideology applied to situations where there is no danger of extinction and where resources are abundant may very well lead, in the future, to a failure to utilize resources rationally on a global scale, and eventually to a loss of biological diversity.
In the 1960s, ecologists proposed a significant shift in philosophy in our approach to nature, which could be paraphrased as follows: "Man and nature are not opposing concepts. Rather, man is part of nature, and the present environmental crisis was caused by the past arrogance of man toward nature." This position subsequently became a political force and later led to global understanding and a movement to practice nature conservation. Now, however, the time has come for ecologists to take a new stance, that is, no living resource should be given preferential treatment on moral grounds as long as it is not threatened by extinction. We must enhance our understanding and awareness of the various benefits that can be derived from living resources, including whales, and strive to develop, manage, and increase the productive capacity of these living resources."
References
Antarctic Ecosystem.
1990, Kerry, K.R., and Hempel, G. (eds)
Springer-Verlag, Berlin.
Distance sampling.
1993. Buckland, S.T., Anderson, D.R., Burmham, K.P., and Laake, J.R.
Chapman & Hall, London
Environment in Peril.
1991. Wolbarst. A.B. (ed)
Smithsonian Institution, Washington D.C.
The stocks of whales,
1965. Mackintosh, N.A.
Fishing News (London)
Preliminary estimates of the southern populations of
the large baleen whales.
1956. Mackintosh, N.A., and Brown, S.G.
Norsk Hvalfaugstiid 45: 469-480.
Marine Mammals Science Vol. 5 (1989).
Nature Vol. 357 (1992)
Report of the International Whaling Commission vols. 29, 41, 43 and 44.
The estimation of animal adundance and related parameters.
1982. Seber, G.A.F.
Charles Griffin & Co., Ltd., London
Wildlife Monograph No. 72 (1980)
_