(from "Report of the Scientific Committee", the version distributed at
2001 meeting)
Analysis had been conducted using DESS with options that have become standard4 for analyses of these surveys (notwithstanding the fact that the analysis methods are currently under review). Alternate options might also be reasonable. While it was agreed that the analyses of these data might be particularly sensitive to changes in the options used, the results did not suggest that the standard estimate was inadequate. The effect of adequate alternate analysis options on the abundance estimate is to be investigated intersessionally.
3 The 1984/85 survey covered only the eastern half of Area IV
4 See Annex G, Item 6.2.2 and Appendix 5
10.2.2 Updated estimates by Area
10.2.2.1 OVERVIEW OF DATA COLLECTION AND TRAINING METHODS
10.2.2.1.1 IDCR/SOWER CRUISES
Changes in the IWC/IDCR and SOWER Antarctic
survey designs and data collection protocols were
reviewed. Notwithstanding the importance of
maintaining consistency over time, there have been two
major modifications and various minor modifications of
survey design during the course of the surveys.
The programme was modified from a combined Discovery marking and sightings program to a rigorous and systematic sightings programme from the second circumpolar set of surveys (starting 1985/86 and referred to as CPII for brevity). At that point, strict identification guidelines were established for sightings of Antarctic minke and Southern bottlenose whales. In the third set of circumpolar surveys (starting in 1991/92; CPIII for brevity), the survey design was modified to cover the whole region south of 60°S, at the expense of full longitudinal coverage of Management Areas in a single year.
10.2.2.1.2 JAPANESE SCOUTING VESSEL DATA
Japanese scouting vessel (JSV) data comprise daily
summaries of sightings from four kinds of vessels (full-time
scouting vessels, operating catcher boats, national
dedicated survey vessels and IDCR vessels), but mainly
from full-time scouting vessels. For a number of reasons
(there is no systematic track design, no record of
sighting distance information, no identification of
primary/secondary sightings), the JSV data are not
suitable for direct density estimation. However, unlike
IDCR/SOWER data, they cover latitudes north of 60°S.
Although they do not extend later than the 1987/88
season, they are potentially useful for extrapolating
IDCR/SOWER abundance estimates northwards and for
examining seasonal migration. Some members
expressed reservations about using JSV data for
extrapolation because weather conditions change with
latitude. JSV data with minke whale sighting records are
available from the 1970/71 season; data with less
systematic and reliable recording of minke whales are
available from the mid-1960s. Dwarf minke whales are
not distinguished from Antarctic minke whales in the
data.
10.2.2.1.3 JARPA
Methodology from the sighting and sampling surveys in
the JARPA programme was reviewed and the
similarities and differences in procedures between the
JARPA and IDCR/SOWER programmes were
reviewed. Both involved searching at about the time of
the peak abundance of Antarctic minke whales on the
feeding grounds. IDCR/SOWER cruises had shorter
research period (early January to late February) than the
JARPA cruises, which typically started in late
December and ended in early March (see Appendix 4 of
Annex G). JARPA surveys involved simultaneous
searching by different vessels in closing mode ('SV
mode' in JARPA terminology - where 'SV' stands for
'sighting vessel') and in 'search and sampling' mode
(SSV mode). In SSV mode animals are caught so that
this mode involves more time off-effort in order to close
on and catch whales. JARPA surveys covered only
Areas IV and V, whereas the IDCR/SOWER surveys
covered all Areas. The areas covered by the JARPA
surveys in Area V were almost always smaller than
those covered by the IDCR surveys.
10.2.2.2 REVIEW OF CURRENT IWC LINE TRANSECT ANALYTICAL METHODOLOGY
The development of the 'standard' analysis
methodology was reviewed; its evolution within the
IWC Scientific Committee is summarised in Annex G
(Appendix 5). Use of the word 'standard' does not
imply that this methodology could not be improved
further; indeed a substantial component of the current
review of Antarctic minke whale abundance estimates
involves a review of the methods and development of
improved methodology. The methods are 'standard'
insofar as they have evolved by agreement within the
Committee (and have been applied consistently over a
number of IDCR/SOWER surveys in the past).
Branch and Butterworth (2001b) report the results of applying this standard methodology to minke whale sightings data from all IDCR/SOWER surveys up to and including the 1997/98 survey, using the IWC software DESS (Version 3.0). It is possible that the resulting Antarctic minke whale estimates may include a very small proportion of dwarf minke whales. Estimates of abundance obtained for three circumpolar sets of surveys: 1978/79-1983/84, 1985/86-1990/91 and 1991/92-1997/98 (*still incomplete) and are 608,000 (CV = 0.130), 766,000 (CV = 0.091) and 268,000* (CV = 0.093) respectively. These surveys have covered 65%, 81% and 68%, respectively of the areas south of 60°S and the ice edge. These estimates are negatively biased estimates of Antarctic minke whale abundance because areas inside the pack ice cannot be surveyed, not all minke whales are in the survey region, the assumption is made that all whales on the trackline are sighted and 'like minke' sightings are omitted.
The Committee welcomed the estimates, which had been updated to accommodate concerns and suggestions made by the Committee on the estimates presented to it in 2000. It expressed its appreciation of the work involved in revising the estimates intersessionally.
It was suggested that alternative methods of analysis, stratification, detection functions, strip width models, pooling methods and school size estimation were unlikely to make a large difference in either the magnitude of the estimates or the relative estimates in the three surveys. By contrast, the potentially large differences in the proportion of the minke whale populations covered on each survey were thought likely to affect the estimates to a much greater extent.
It was noted that violation of the assumption that all animals on the trackline are detected (g(0)=1), on which the estimates of Branch and Butterworth (2001b) are based, would affect the estimates in ways that are not entirely predictable. It was also noted that it would be preferable to estimate abundance without the assumption that g(0)=1. Several attempts to estimate abundance without the assumption in the past have been unsatisfactory, but recent methodological developments are promising in this regard.
10.2.2.3 FACTORS THAT MAY INFLUENCE ABUNDANCE ESTIMATES
AND THEIR TRENDS
10.2.2.3.1 SCHOOL SIZE ESTIMATION
The performance of the DESS school size estimation
rule was examined against two alternatives. It was noted
that the standard methods of estimating school size
depend on g(0)=1 and that this was certainly not true for
all schools in all conditions. It was also noted that the
regression method used to estimate mean school size
might be sensitive to the form of the detection function
used. Investigation of alternate estimation methods that
do not rely on the g(0)=1 assumption was considered
important.
The Committee recommends that the modified approach to estimating school size suggested in Branch and Butterworth (2001b) should be implemented in DESS and should be used in future analyses from IDCR/SOWER surveys pending the development of models which either provide satisfactory estimates of g(0) or do not build certain detection on the trackline into their assumptions.
10.2.2.3.2 STRATIFICATION/POOLING
Sample size considerations limit the degree to which
stratification can be used in estimation. Following
recommendations made last year. Branch and
Butterworth (2001b) investigated pooling options for
estimation of effective strip width (esw) and mean
school size and suggested that the AIC criteria usually
used to decide on pooling should be replaced by an
alternative rule outlined in Annex G. In addition, other
possibilities were suggested in discussion. The
Committee agreed that the use of this new method
needed to be considered further. It also noted that
methods that model detection probability as a function
of covariates should require less pooling of data and
should be investigated and applied to these data.
10.2.2.3.3 OBSERVER EFFICIENCY
Average observer experience on the third set of
circumpolar surveys is lower than that on previous
surveys. Results of analyses investigating the
relationship between observer experience and sighting
efficiency were presented to the Committee. It was
noted that this analysis suggests a substantial and
significant difference in the sighting rates with
experience when observers work alone in the IOP.
However, it is not clear what the overall effect of this is
in practice because other observers may sight schools
that the less experienced observer might have missed.
The data are inadequate to determine if this is a cause of
the lower abundance estimates obtained from the third
set of circumpolar surveys because the increased
proportion of less experienced observers since 1990 has
resulted in there being too few observations involving
experienced observers alone in the third circumpolar
survey.
The effect of two methods of estimating observer
efficiency on circumpolar estimates of abundance was
examined. Two analyses based on different assumptions
indicated either: (a) that changes in observer efficiency
changed overall abundance estimates by only a few
percent; or (b) they resulted in an increase in the ratio
of third to second circumpolar abundance estimates
from some 35-40% to 45-50%. It was noted that the
effect of observer efficiency on g(0) may be more
complicated than is assumed in the above analysis.
10.2.2.3.4 CHANGES IN 'LIKE-MINKE' CLASSIFICATION
When observers believe a sighting is of a minke school,
but have some degree of uncertainty about this, the
sighting is classified as 'like-minke'. Results were
presented showing that the proportion of 'like minke'
sightings had increased over time, from negligible levels
in the first circumpolar set of surveys to over 30% in IO
mode in the third. If 'like minkes' are included in
abundance estimates, those for closing mode increase
only slightly because esw estimates also increase. The
IO mode estimates for the second and third circumpolar
sets of surveys increase by some 10% and 20%
respectively.
Analyses examining the relationship between observer experience and the proportion of 'like-minke' sightings concluded that the increase of 'like minke' whale sightings in recent years seems not to be caused by the introduction of inexperienced observers. Other reasons, such as the increasing number of species codes and the extent of survey coverage to the northern stratum (in which weather is worse and school sizes smaller on average) may have caused difficulties in determining the species.
10.2.2.3.5 ANIMALS MISSED ON THE TRACKLINE AND DUPLICATE IDENTIFICATION
'Standard' analyses assume that all animals on the
trackline are detected - that g(0)=1. Probability of
detecting animals on the trackline is likely to depend on
school size and the assumption that g(0)=1 for small
schools at least, is almost certainly violated; abundance
estimates are biased as a result, although the bias may
be small. There was considerable discussion about
whether multi-platform analyses could yield estimates
of g(0), given the problems encountered in attempting
this in the past. One of the major problems discussed
was that of non-independence of sightings from the IO
and barrel platforms due to the availability of visible
cues. The approach outlined in SC/53/IA31 could in
principle accommodate this difficulty (although it
requires accurate species identification) and the
Committee recommends that this method be applied to
the IDCR/SOWER data.
Net bias in abundance estimates when g(0) is less than 1 is necessarily negative, even though g(0) depends on school size and so estimation of mean school size by extrapolating to perpendicular distance zero (as the regression method does) provides a positively biased estimate of mean school size (see Appendix 15 of Annex G).
Crude estimates from SC/53/IA27 suggest an effect of about 15% due to assuming g(0)=1. Crude analyses of duplicate proportions suggest that g(0) might have decreased by as much as 40% in Area I from CPII to CPIII (see Appendix 6 of Annex G).
10.2.2.3.6 EFFECT OF ENVIRONMENT ON SIGHTING CONDITIONS
Results were presented indicating that esw depends on
sighting conditions, as expected. The Committee
recommends that methods be developed and applied
that model detection probability as a function of
covariates (including sightings conditions) and that
further effort be invested to develop methods that would
allow reliable estimation of abundance without
assuming g(0)=1.
10.2.2.3.7 TIMING OF SURVEYS AND ENVIRONMENTAL FACTORS
Analyses on the timing of migration to the Antarctic
were presented, using: (a) JSV data from 1966/67 to
1987/88 in the waters south of 40°S in the Areas III, IV
and V; and (b) using CPUE and sightings survey data
information. Both indicated a peak abundance of whales
in the waters south of 60°S in late January. There is also
indication of a rapid decrease in the proportion of
whales in this region in February. This suggests that a
longer research period in February in the recent
SOWER surveys may have resulted in increased
negative biased abundance estimates from recent
surveys. Although taking account of the migration
trends indicated by the CPUE and sightings data
increases estimates of abundance by roughly 25%, it
affects the ratio of the estimates for the third and second
circumpolar sets of surveys negligibly. This may be a
consequence of Area-specific differences in migration
timing and the fact that the Ross Sea, which contains
high abundance, was surveyed relatively later.
It was noted that the spatial modelling methods outlined in SC/53/IA29 could be used to estimate temporal as well as spatial trend in abundance in the survey regions and should be less susceptible to any bias resulting from possible differences in migration timing in different regions.
Results were presented detailing changes in the sea ice extent from 1979 to 2000. During the period of ice retreat, the monthly extent of the ice between mid-December and mid-February was highly variable, as expected. There was also considerable variation in its extent between years, with most variability in Areas II, V and VI. It was noted that the nature of the variability in sea ice concentration within years differed between geographic areas, suggesting the need to consider the effects of the ice configuration in its totality, not only its latitude, on abundance estimates. The Committee noted the importance of estimating minke whale abundance south of the ice edge, but in the absence of more information, no quantitative conclusions about this abundance could be drawn. It recommends that this issue be addressed intersessionally.
10.2.2.3.8 CLOSING-PASSING MODE CALIBRATION
Since 1991, IDCR/SOWER analyses have applied a
correction factor, R, to calibrate Closing mode estimates
(which are acknowledged as potentially biased) to those
estimates that would have been obtained had the
Closing mode survey been in IO mode. Currently, a
single estimate of R is calculated, this estimate being
updated annually (although the estimate of R used in
analyses of IDCR/SOWER data, such as those presented
in SC/53/IA3, uses data from surveys up to and
including the 1988/89 survey.) However, the Committee
noted that the extent of bias in closing mode is believed
to be density dependent and thus that it was
unreasonable to assume that R is constant across years.
The change in the proportion of 'like-minke' sightings
adds further evidence to support this conclusion and it
was agreed that alternative methods which allow a
calibration to be estimated separately for each survey
should be investigated.
10.2.3 Inter-year comparisons and trend
10.2.3.1 DEALING WITH VARIABLE PARTIAL COVERAGE
10.2.3.1.1 EXTRAPOLATION TO UNSURVEYED REGIONS
Problems with comparability between estimates from
the three circumpolar sets of surveys arise because of
two factors relating to survey coverage. Firstly, most
surveys in the first two circumpolar sets did not
completely cover the full latitudinal range to 60°S.
Secondly, the third circumpolar set of cruises has not
yet completed a full circuit of the Antarctic - the
longitudinal ranges of 140°W-160°W and 80°E-130°E
have yet to be surveyed. The Committee considered
three possible approaches for estimating density in these
unsurveyed regions. The first assumes that the
unsurveyed northern areas have the same density of
whales as the northern surveyed strata in each survey
and uses the density in the covered part of these
northern strata to extrapolate abundance estimates to a
common area south of 60°S. Extrapolating in this way
and correcting for different longitudinal coverage results
in comparable circumpolar estimates of minke whale
abundance on CPI, II and III of 729,000 (CV=0.150),
824,000 (CV=0.117) and 359,000 (CV=0.108). These
estimates apply to 280° of a possible 360° longitude for
complete circumpolar coverage.
Exploratory analysis of the utility of two spatial modelling methods for extrapolating and interpolating into unsurveyed regions were presented. Both performed well on the data they were applied to and the Committee recommends that these approaches be developed further intersessionally.
10.2.3.1.2 JSV DATA
SC/53/IA11 used JSV data in the waters south of 40°S
in Areas III, IV and V from 1966/67 to 1987/88 to
extrapolate abundance estimates from IDCR/SOWER
surveys north of 60°S to 40°S. A GLM with research
period, season, latitude and longitude as explanatory
variables and presence/absence as the binary response
variable was fitted to the JSV data. Using JSV daily
encounter rates pooled over longitude, together with the
fitted GLM, relative abundance is predicted over the
range of latitudes spanned by the JSV data. This is used
to extrapolate the IDCR/SOWER estimates north of
60°S. Of the minke whale population in these Areas,
30% are estimated to be north of 60°S. There are a
number of sources of possible bias associated with this
extrapolation method, some positive and some negative.
Butterworth briefly outlined the results from an analysis of JSV data from 1978/79 (Borchers et al., 1990). He reported that including minke whales (and dwarf minke whales) that are distributed north of 60°S would result in an increase of about 10% to the estimates using data from south of 60°S only.
10.2.3.1.3 ANIMALS WITHIN THE PACK-ICE
Results relating to the estimation of minke whale
abundance south of the ice edge were presented. The
Committee welcomed this first attempt at estimating the
number of minke whales that may be present within the
pack ice, but was unable to reach any conclusions other
than noting that some minke whales are present within
the ice, but that their numbers are unknown. It
encouraged efforts to ensure that more information on
surveys within the ice are presented at next year's
meeting. The Committee supported the conclusion in
SC/53/IA14 that surveys within the ice would provide
useful data on Antarctic minke whale abundance. The
Committee recommends that the minke whale data
available from the APIS program be analysed
intersessionally to provide estimates of abundance south
of the ice edge.
10.2.3.1.4 JARPA DATA
The Committee noted the likely utility of the spatial
modelling methods discussed under Item 10.2.3.1.1
above, for extrapolation and interpolation of JARPA
survey data into unsurveyed regions on IDCR/SOWER
surveys within and between years.
10.2.3.2 TRENDS IN ABUNDANCE
At its last meeting, the Committee noted the fact that the
overall abundance estimate from crude extrapolations
from the third circumpolar set of IDCR/SOWER
surveys5 was appreciably lower than the total of the
previously agreed point estimates by Area from the
1990 Comprehensive Assessment (IWC, 2001i, p.189).
It also noted that there are a number of factors that make
interpretation of this difficult. The Committee
reconsidered the issue this year, in the light of the
substantial new analyses that had been conducted
intersessionally.
The possible utility of population dynamics models for the review of Southern Hemisphere minke whales had been noted last year (IWC, 2001j, p.199). At that time, initiation of work on population dynamics modelling had been considered premature. Having made substantial progress on other aspects of the review since then, the Committee revisited the issue.
It agreed that the interpretation of trend in a meaningful way required some form of population dynamics modelling and that this should take account of sightings and other data in addition to those provided by analyses of the IDCR-SOWER sightings data. While opinions differed on the likelihood of being able to interpret the results of such modelling in a way that would conclusively explain the trend in estimates (since the distinction between process error and sampling error was based on the modelling assumptions), the Committee recommends that population dynamics models should be examined at the earliest opportunity.
SC/53/IA13 examined year to year trends in the biological parameters of Antarctic minke whales from 1971/1972 to 1999/2000, using both commercial and JARPA data. The authors believed that these data provide no evidence to support a decline in Antarctic minke whale abundance after the early 1970s and in particular not since 1987.
Branch and Butterworth (2001b) contains updated estimates of abundance from the IDCR/SOWER surveys from 1978/79 to 1997/98 using currently standard6 estimation methodology. It also contains estimates for each survey that have been corrected for different survey coverage of the population in a crude but reasonable way. The total estimated abundance from CPIII is significantly lower at the 5% level than the comparable total for CPII. This is true both when the estimates are corrected for different survey coverage and the inclusion of 'like-minke' sightings (but no other factors) and when they are not.
SC/53/IA27 considered the effect of the following factors on the abundance estimates: an increase in the proportion of 'like-minke' sightings over time; different survey coverage; changes in the method used to estimate mean school size; the decreasing trend in observer experience; changes in the timing of the surveys. Results indicated that the effects with largest impact on abundance estimates were the change in the area covered by the survey and decreased observer efficiency7, although no firm conclusions could be drawn in this regard, given the simple and exploratory nature of the analyses. Choices for the various factors in combination, which likely err towards positive bias, suggested an increase in the ratio of abundance estimates for the third compared to the second circumpolar set of surveys from 35-40% to 65-75%.
SC/53/IA12 presented estimates of the abundance of Antarctic minke whales in Areas IV and V from 1989/90 to 2000/01 using sighting data obtained from JARPA surveys. The standard methods were used (for comparability with analyses of IDCR/SOWER data) and trends in abundance estimates were examined. It was assumed that abundance estimates from SV data can be treated as a relative abundance index, as proposed previously (IWC, 2001i, p.188). Since the time series of sightings data from Sighting and Sampling Vessels (SSVs) is longer than that for Sampling Vessels (SVs), the SSV data were converted to pseudo-SV data, using the method described in Haw (1991) to extend the time series available for examining trends in abundance. The trend in relative abundance using the SV and pseudo-SV abundance estimates was estimated to be - 0.04% with 95% CI (-4.32%, 2.90%) in Area IV and 0.83% with 95% CI (-2.44%, 4.19%) in Area V; in neither Area is the estimated trend significantly different from zero. The authors conclude that neither a significant increase nor a significant decrease in the abundance of minke whales has occurred in Areas IV or V since the JARPA surveys commenced.
In discussion of these results, it was noted that the JARPA estimates had not been considered in the detail in which the IDCR/SOWER survey estimates had been considered at this meeting. It was also noted that some considerations that apply to the IDCR/SOWER survey estimates do not apply to the JARPA estimates (the major changes in survey design between circumpolar sets of surveys is a case in point) and vice-versa. It was also considered important that direct comparisons between JARPA estimates and IDCR/SOWER estimates for Areas IV and V be presented to the Committee's next meeting. The Committee recommends that an attempt should be made before next year to determine whether there is a statistically significant difference in trend between density estimates from JARPA survey data and those from IDCR/SOWER surveys in Areas IV and V and that IDCR/SOWER estimates be presented for Areas excluding IV and V. It further noted that application of spatial modelling methods to IDCR/SOWER datasets, as detailed in Annex G (Appendix 10) could provide estimates at higher spatial resolution.
The lack of a trend in these estimates contrasts with the fall in abundance estimates reported in Branch and Butterworth (2001b), although it should be noted that the JARPA surveys occur only in Areas IV and V, whereas the IDCR/SOWER surveys cover all Areas. The timing of JARPA surveys has remained approximately constant throughout, whereas since 1994/95, the IDCR/SOWER surveys have started later (see Appendix 4 of Annex G). Concerns were expressed about this change of timing as evidence of peak abundance in the survey region (see section 10.2.2.3 above) suggests that the change to a later date may have led to some of the survey areas being covered after the peak in more recent surveys rather than at about the time of the peak on earlier surveys. Furthermore, the JARPA surveys spanned a longer period of time in the survey areas so one would expect that they might be less sensitive to the location of the peak. The Committee agreed that if it was logistically feasible, future IDCR/SOWER surveys should revert to the time schedule of earlier surveys. Although taking account of the migration trends indicated by the CPUE and sightings data increases estimates of abundance by roughly 25%, it affects the ratio of the estimates for the third and second circumpolar sets of surveys negligibly.
It was noted that even when the IDCR/SOWER abundance estimates of Branch and Butterworth (2001b) are adjusted using what in the context of results from SC/53/IA27 are likely positively biased correction factors, the total corrected abundance estimate from CPIII (corrected for the factors indicated in Branch and Butterworth, 2001b) remains lower than that from CPII. Interpretation of this result is difficult. The Committee did not have the necessary results to determine whether the difference between the corrected estimates of abundance for CPII and CPIII were statistically significant.
After considering many of the factors affecting abundance estimates that were identified last year, there is still evidence of a decline in the abundance estimates from CPII to CPIII, although it is not clear how this reflects any actual change in minke abundance. Three hypotheses that might explain these results were identified:
- (1)
- a real change in minke abundance;
- (2)
- changes in the proportion of the population that is present in the survey region at the time of the survey;
- (3)
- changes in the survey process over the course of the surveys that compromise the comparability of estimates across years.
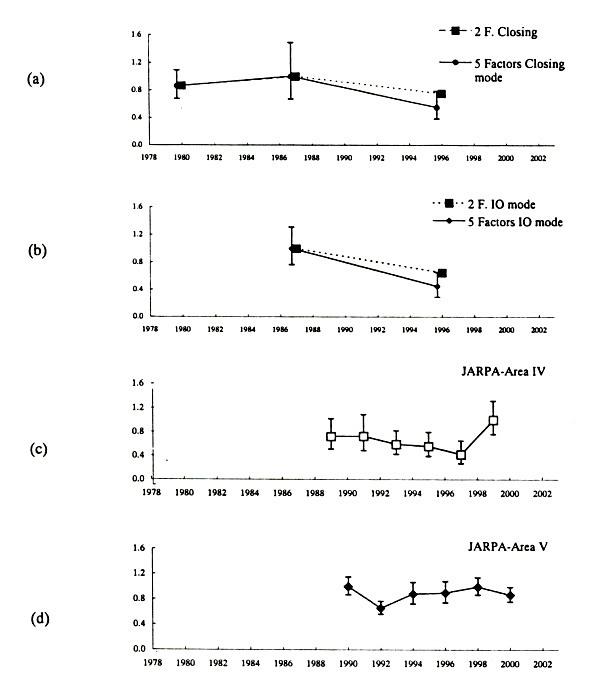
Fig. 1 (a) and (b): Estimates of relative abundance from the three sets of
circumpolar IDCR/SOWER surveys of Antarctic minke whales from the three
circumpolar sets of IDCR/SOWER surveys.
Because of incomplete longitudinal coverage, the estimates account for only
280° of a possible 360° longitude.
Estimates are shown separately for (a) Closing mode and (b) IO mode.
Within each mode, estimates are shown which (i) include corrections for
incomplete survey coverage south of 60°S and the inclusion of
"like-minke" (these are called '2 Factors' in the plots), and also for the
case in which (ii) correction is made for incomplete survey coverage south
of 60°S and inclusion of "like-minke", school size estimation method,
timing of the survey relative to the migration peak of minke whales south
of 60°S, and observer efficiency (These are called '5 Factors' in the
plots).
Vertical bars represent approximate 95% confidence intervals.
These are likely too narrow because they do not include uncertainty due to
estimation of the correction factors.
It should be noted that the estimates have not been corrected for any change
in g(0) (effect on abundance estimates could be large: 15 and 40%),
or the proportion of animals south of the ice edge that may have occurred.
Estimates might change somewhat if different analysis options are used in
obtaining the point estimates.
Fig. 1 (c) and (d): Estimates of relative abundance in (c) Area IV and
(d) V only, from JARPA data, together with estimated 95% confidence limits.
These estimates do not include corrections for any of the factors noted.
Fig. 1 shows the comparable estimates of the relative abundance of Antarctic minke whales from the three circumpolar sets of IDCR/SOWER surveys and estimates of relative abundance of Antarctic minke whales in Areas IV and V only from JARPA survey data. Note that the IDCR/SOWER survey estimates cover 280° of the possible 360° of longitude spanning the Antarctic, whereas the JARPA estimates cover only Areas IV and V.
The likely size of the effect on the relative size of the IDCR/SOWER abundance estimates of Branch and Butterworth (2000), from CPIII compared to estimates from CPII. The 'effect' is the percentage change in the ratio of abundance estimates from CPIII to CPII that results from correcting for the factor. For example, if half the population was surveyed on CPIII and the full population was surveyed on CPII, the effect would be 100%. An effect of 0% is no change.
| Likely size of effect | Evidence of size of effect | |
|---|---|---|
| Population-related factor | ||
| Change in coverage of Management Area | Medium | Crude estimate: 20% effect |
| Change in location of ice | Uncertain, likely small | 2%-7% increase in open water sea |
| Change in timing of the survey | Uncertain | Recent IDCR surveys occur later in the year |
| Change in proportion of animals south of ice edge | Uncertain | 11% decrease in ice area |
| Change in school size distribution | Small | |
| Survey-related factor | ||
| Change in 'like-minke' proportion | Small | Crude estimate: 5% effect |
| Change in probability of detection on trackline | Uncertain, could be large | Crude estimates: 15% and 40% |
| Change in Closing mode vs IO Mode bias | Small | Estimate: change of a few % |
5 The third circumpolar set of IDCR/SOWER surveys is abbreviated
to 'CPIII' in what follows; the second set to CPII and the first set to
CPI.
6 See Appendix 5 of Annex G
7 The size of the observer effect can be estimated in two ways,
depending on assumptions about the way it operates. The correction
factor used here was obtained using those assumptions that result in it
having the larger effect.
10.2.4 Plans for completion of minke review
10.2.4.1 DESIGN ISSUES
The importance of maintaining a consistent survey
design throughout the period under study was
emphasised and it was noted that there are
uncontrollable spatial and environmental factors which
affect the estimation of trend and interpretation of
results. The Committee noted the substantial process
error associated with estimates of trend and abundance
from the IDCR/SOWER surveys. Some design
considerations are given in Annex G (Appendix 9),
including outlines of two possible alternative transect
designs.
10.2.4.2 WORKPLAN
Annex G (Appendix 10) details the tasks identified by
the Committee to further the review of Antarctic
abundance estimates, together with an indication of
priorities for the next year. Noting the need to resolve
the issue of whether or not minke whale abundance has
declined in recent years, the Committee strongly
recommends that substantial progress be made on high
priority tasks by the 2002 meeting of the Committee. It
also recommends that JARPA estimates of abundance
and trend in Areas IV and V should be evaluated in a
similar way to the way the IDCR/SOWER survey
results were evaluated this year.
The Committee recalled that at its last meeting it had strongly recommended holding an intersessional workshop to consider estimation methods and estimates for Antarctic minke whale abundance and trend, but that this had not been funded. It reconsidered the issue this year and drew the Commission's attention once again to the importance of supporting the Committee's work under this Item if the review of Antarctic minke whale abundance and trend is to be successfully completed in the near future. It repeated that the review would necessarily span a number of years. It also noted that the process of methodological development was open-ended and that there was a need to specify a realistic deadline for completion of the review. Given that the third set of circumpolar surveys will be completed in 2002/3 and that the review cannot be completed by its 2002 meeting, the Committee proposes that estimates of Antarctic minke whale abundance and trend using the improved methodology developed in the course of the review be presented for the three full circumpolar sets of IDCR/SOWER surveys at its 2003 meeting.
Recognising also that some further analyses might be required in the light of these results, the Committee proposed further that the review be finalised at its 2004 meeting. The Committee will develop more detailed plans for intersessional work related to the review at its 2002 meeting and, if necessary, at its 2003 meeting.
In order to provide sufficient time at its next meeting to consider the results of intersessional work and to plan its work for the remainder of the review, the Committee strongly recommends that a full two days be set aside immediately before the 2002 meeting specifically to address methods and results relating to the estimation of Antarctic minke whale abundance. It further noted that the arrangement this year, in which less than two days were set aside for this purpose and the second of these overlapped the first day of the Scientific Committee meeting, had compromised the effectiveness of the meeting.
The budget requests are considered under Item 21. They include successful completion of the 2001/02 SOWER survey, and recommends a two-day meeting and other high priority items from Annex G (Appendix 10).
10.2.5 Other
The results of genetic analyses in SC/53/IA17
re-emphasised the importance of collecting genetic
samples from whales in putative breeding grounds in
lower latitudes. It was also noted that the results suggest
that estimation of population dynamics model
parameters may be more complicated than previously
envisaged.
_